Plotting: Making User Interviews Visible
How to make remote interviews more visual and fun

I first gave a talk on this topic for UXRConf 2019 as a way to overcome some of the cognitive limitations of spoken user interviews. Now that we are remote-first due to COVID-19, visualizing participant mental models is even more important. This post is an adaptation of the talk for our times today.
Limitations of Spoken User Interviews:
User interviews are one of the most flexible methods for UX Research, yet we are all familiar with their constraints. Namely, there’s always a wealth of information to dive into in a short period of time.
To illustrate, we’ll be using breakfast as an example for the rest of this post. Let’s pretend we work for a CPG company, looking at people’s attitudes and behaviours about breakfast.

Here’s what a typical spoken user interview may look like:
Interviewer: What do you like to eat for breakfast?
Participant: Eggs, oatmeal, and sometimes bread.
Interviewer: How do you like your eggs?
Participant: If there’s boiled eggs in the fridge, I’ll eat them. If there’s time, I’ll spice it up with an omelet. If there’s mounds of time, I’ll make a poached egg.
Interviewer: When do you choose oatmeal instead of eggs?
Participant: When I want to eat more healthily. Eggs can sometimes have too much cholesterol, and that’s something I’m watching out for.
Interviewer: What about bread?
Participant: When I know I’ll have a hard day ahead and need the carbs.
Interviewer: How do you prepare the bread?
Participant: If I want to be fancy, I might toast in the pan and put the egg on top. Otherwise I just eat it without any preparation.
What you’ll notice from the dialogue above is that the interviewer might want to dive into each breakfast item in depth, with follow-up questions for each.
With user interviews, they’re great for conversational storytelling, but really only one thread at a time. What’s worse, our brains are not built to hold a lot of information. That’s because our working memories are limited, we experience cognitive load when there’s more information than there are capabilities to process them.
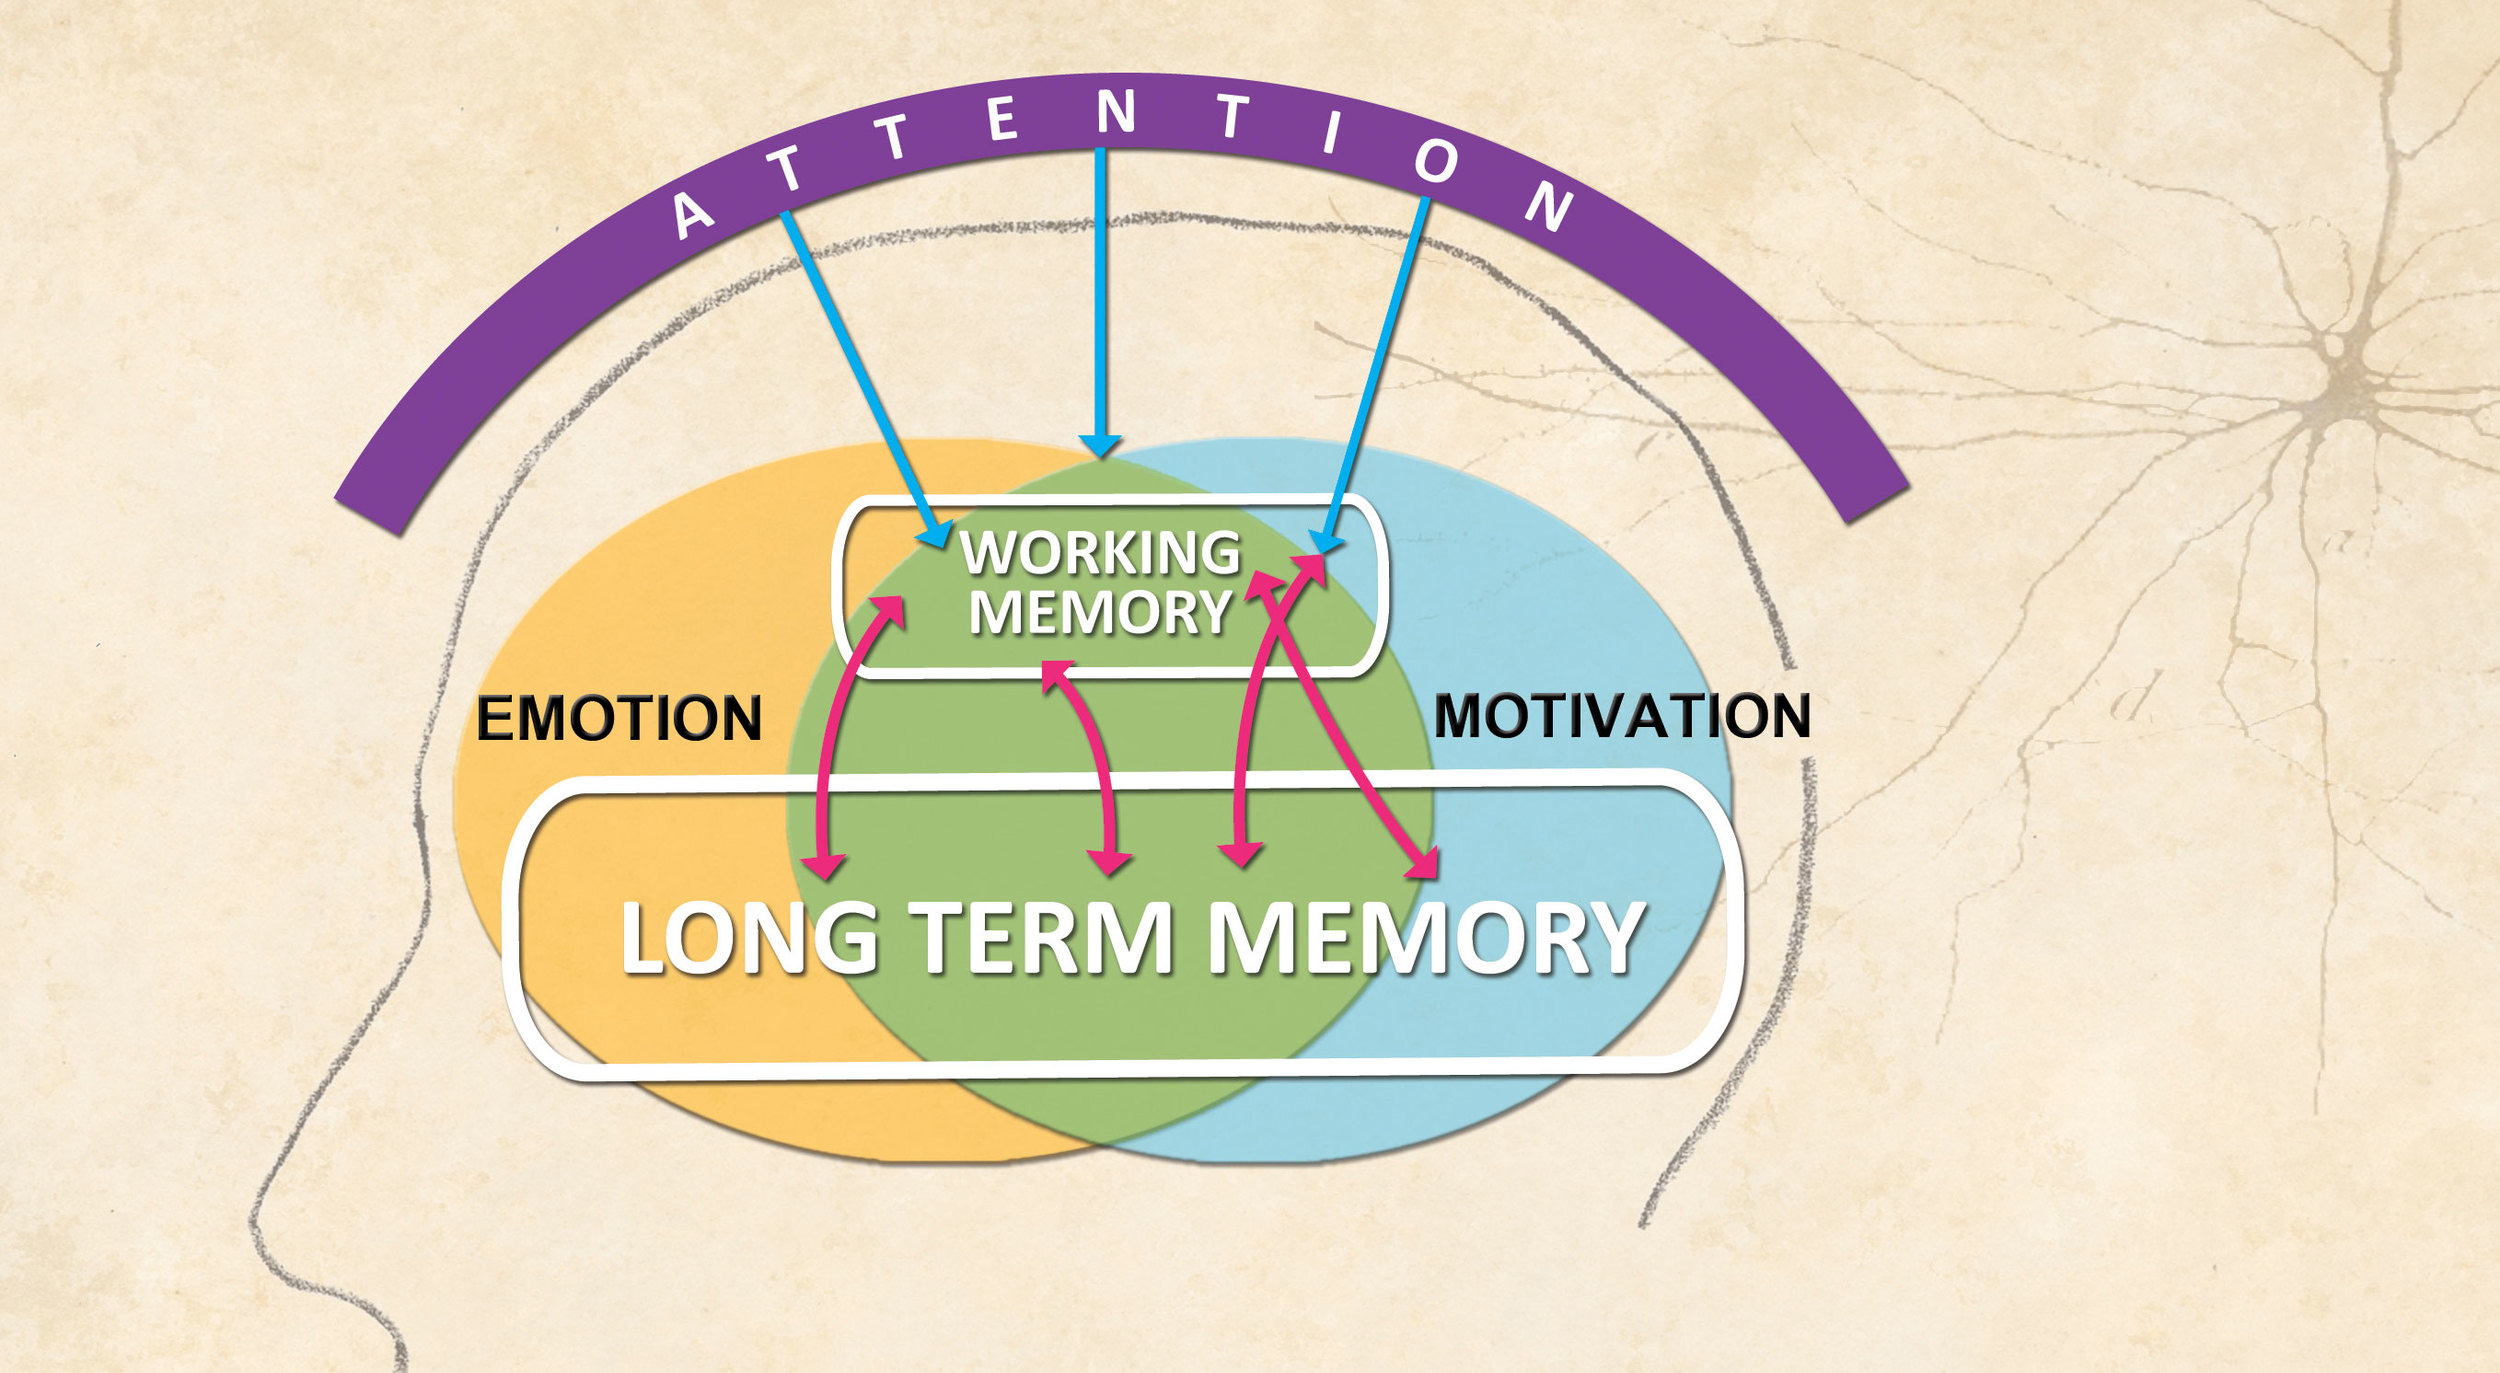
First, a primer on how our brains and memories work. 3 terminologies:
attention: the ‘spotlight’ we use to begin processing sensory information from the world
long-term memory: where we hold long-term information from the past that we want to retrieve for usage
working memory: temporary storage for information, which you can manipulate while in working memory
And 2 processes involved with these components:
Encoding process: information comes in from the world. When I pay attention to it, the information gets held in working memory as I process and decide which parts to encode into long-term memory.
Retrieval process: information from long-term memory is being retrieved and held in working memory as I decide what to do with it.
http://translatethebrain.com/professionaldevelopment
So working memory is very crucial for how we function. Problem though: working memory is temporary (15-30 seconds), and it’s limited in storage (holds ~7 items). 7 items, 15 seconds. Not a lot of processing power.
This is where cognitive load comes in: when we have more information than we have capabilities for processing.
Cognitive load applies to user interviews, to both interviewer and participant. As participant, they are actively retrieving information from long-term memory, holding within working memory, deciding how to share with you the interviewer, and doing all of this within a short period of time.
Likewise, for interviewer, we also have a lot of cognitive load. We have to pay attention to what’s being shared with us, hold that information in our working memory, decide what to encode into long-term memory, and also decide what to probe deeper into based on what people are saying.
As you can tell, lots of information, not a lot of space in our minds to process it all.
Fortunately though, we have evolved cognitive aids to help us. Cognitive aids are things like checklists, glossaries, concept maps, etc. They allow us to offload some of the demands on working memory onto a more physical form — so we don’t have to hold it all up in our brains.
Introducing: Plotting
With this pre-amble on working memory and cognitive load, how can we make user interviews less cognitively demanding and more visible?
Introducing Plotting. Essentially, plotting is a combination of concept mapping and the think-out-loud protocol.
The goal of plotting is to gauge at people’s mental models through conversation and visual representation.
Let’s use our breakfast example to look at how plotting would work. The first step is to capture all the different breakfast items the participant likes to eat. Eggs, salad, fruit, bread… all the raw elements are captured onto individual sticky notes.
This capturing can happen by the participant or by the interviewer, noting down the different items. This is the first phase.

The second phase is where the interactivity happens. As we are doing this capturing of raw elements, we are doing this in a shared document that can be viewed by both the interviewer and interviewee. With remote interviews, my favourite tools for capturing these on a shared board are Mural and Miro.
Then the interviewer can ask the participant to plot each raw element against a visual framework predefined by the interviewer. Before the interview, the interviewer can decide on a visual framework to use for a particular research question, and the participant can interactively plot out the pieces against the framework the researcher has chosen.
The participant is doing this real-time and thinking out loud, so the interviewer can follow along on the thought process. The goal is for the interviewer to gain a more nuanced understanding of how the concepts are structured and related in the participant’s mind — their mental model.
Here are 4 types of visual frameworks the researcher might have pre-defined:
1) Categorical Plotting, similar to card sorting. For this type of plotting, the participant is moving content pieces into categories that are either pre-defined (“closed”) or created by the participant real-time (“open”). The goal is to show how items or concepts relate in participants’ mind, and why.

2) Dimensional Plotting, where the raw elements are placed against a continuous dimension and thinking out loud. This helps us surface how concepts rank in people’s minds.

3) Multi-Dimensional Plotting, where concepts are mapped against multiple pre-defined dimensions. This helps us see interactions of raw elements with different dimensions, to see clustering patterns.
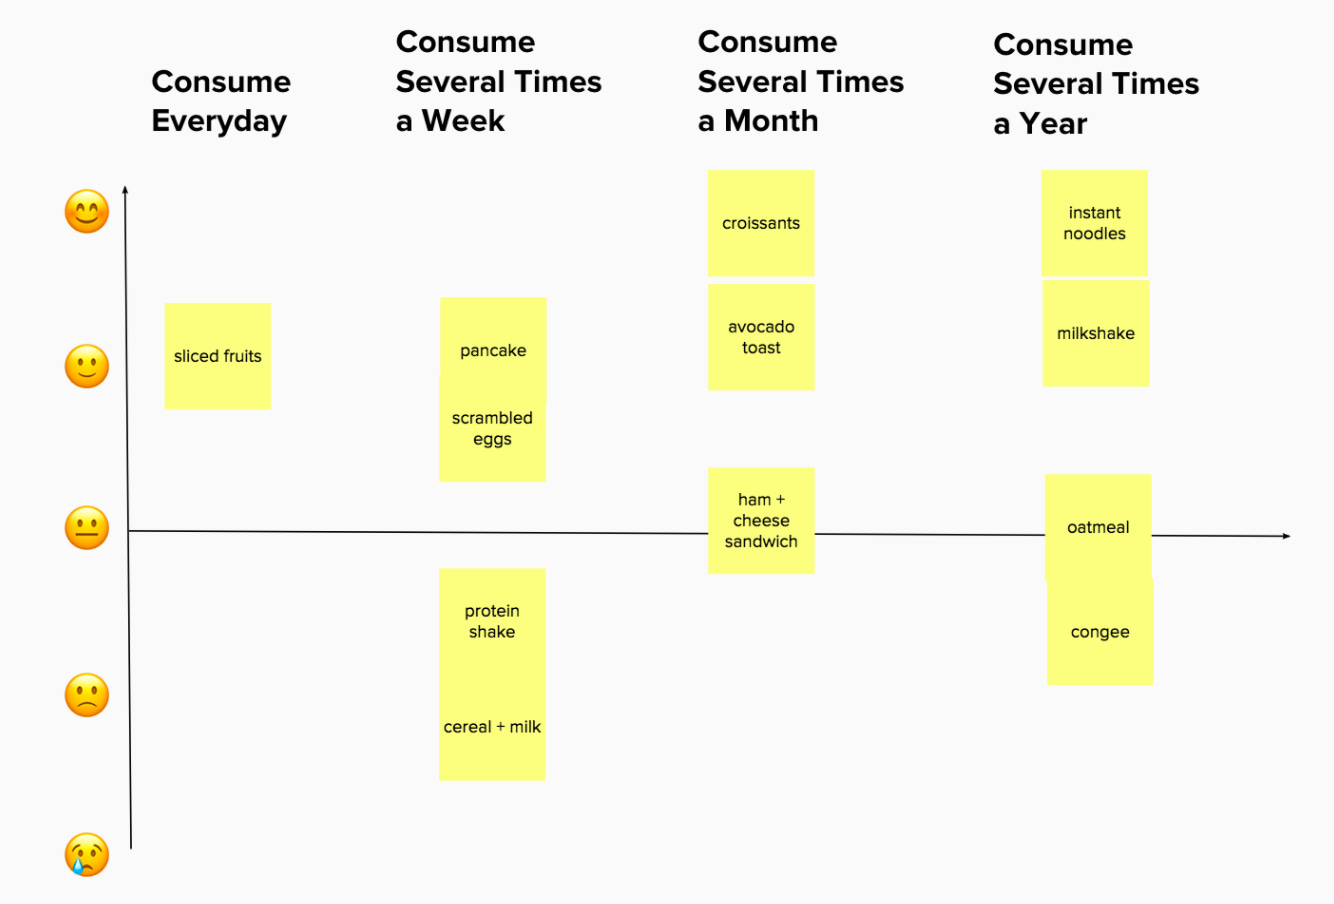
You might see clusters forming. For example, there are 2 clusters of breakfast items consumed several times a week — one cluster that the participant feels good about, one that they don’t feel as good about. After deep-diving with the participant, perhaps the insight here is that the happy cluster is considered a ‘treat’ when there’s time to prep these items, while the not-so-happy cluster is considered more practical grab-and-go options.
4) Story Plotting, similar to storyboarding and journey-mapping. Participant is capturing key actions and events in an experience, and plotting out the emotional dimensions along the way. This helps us see key events along an experience, as well as how the participant feels throughout.

If you’re wondering about the difference between Plotting versus Card Sorting, I see their difference as being two-fold. First, plotting is more living within the problem space of the double diamond, while Card Sorting is more in the solution space. Additionally, their goals are different. Plotting is to inform exploratory research, while the goal for Card Sorting is to inform information architecture.
How do I Use Plotting?
Generally, you can use plotting when you’re doing exploratory research to understand the problem space, when you have multiple items to probe deeper into, and when you want to look at relational connections between items in people’s minds.
There are a number of benefits to plotting. You get to save time by zooming into specific parts of the board with participants (instead of describing the topics to dive into more deeply). Also, there is a lot more interactivity and participants tend to be more engaged than straight-up talking for an hour. Additionally, you can get a full range of the items to investigate for any given topic. Finally, it makes synthesis a little easier, with the frameworks already pre-made. You’re essentially looking at frameworks across participants to look for patterns and themes.
In terms of how to use plotting, it looks fairly similar to general research methods:
Define the research question you want to investigate
Establish the framework: decide on the visual framework and what it would look like (e.g. categorical plotting, multi-dimensional plotting)
Pre-plan interview questions: figure out the best phrasing of the series of questions to the participant
Conduct the sessions
Synthesize by looking for similar themes and patterns across participant frameworks
Overall, plotting is a flexible, visual way of conducting user interviews. It overcomes some of the limitations of our working memory, and makes interviews more fun and engaging. Give it a try and let me know how it goes!